09/18/2024 — Key takeaways:
- September has historically been the most challenging month for stock market performance.
- Market headwinds this September have dashed hopes for an end to volatility.
- Instead of dwelling on volatility, investors should focus on staying invested through market cycles with an all-season portfolio.
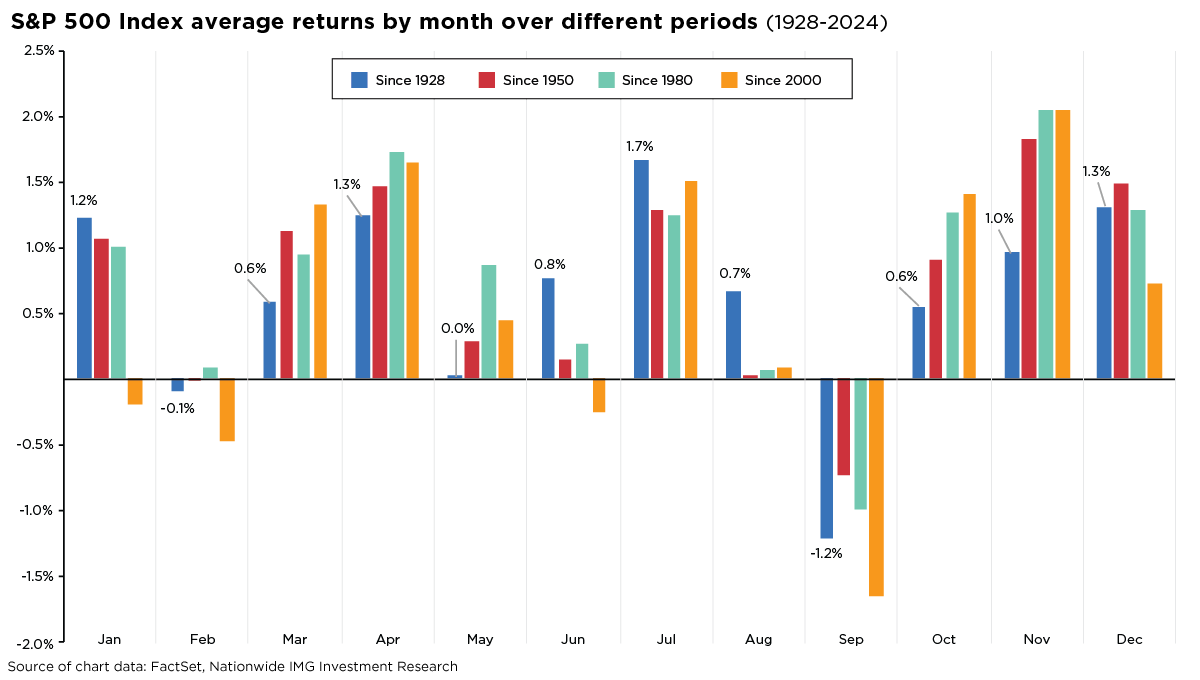
Historically, September has been the most challenging month for stock performance. Since 1950, the S&P 500® Index average return for September has been -0.7%. The Index has finished September on the positive side less than half of the time, underscoring the volatile terrain that investors have historically traversed during this month.
More recent history hasn’t looked better. In September of the previous four years (2020-2023), the S&P 500 has declined by 3.9%, 4.8%, 9.3% and 4.9%, respectively. The first week of September 2024 ranks as the worst first week for the S&P 500 on record; only in four other years did the S&P 500 drop by over 2.5% during the first week of any month.
So far this September, stocks seem to be on a similar course, down 0.3% after the first two weeks (through Friday, September 13). It started on the first trading day of the month, as the S&P 500 dropped over 2%, the market’s worst daily performance since the start of August. Stock investors attributed much of this downdraft to escalating concerns about global growth. For investors hoping the volatility from last month might fade, September’s seasonal headwinds have thus far dashed that optimism.
The last few weeks may have shown that market winds shift unexpectedly, they can also shift for better instead of for the worse. Looking at the historical record, since 1950, stocks have typically traded sideways during the first half of September, with losses often coming in the second half of the month. The next two weeks may bring further volatility, starting with the next Federal Reserve rate-setting meeting in the middle of the month. The Fed’s decision could be a catalyst for increased volatility, either on the upside or the downside.

While there’s no guarantee that September’s historical seasonality will repeat this month, long-term stock investors may be encouraged to know that, on average over the last five and ten years, the October-to-November period has exhibited the strongest performance. Data since 1950 shows that November is typically the strongest month for stocks, with December a close second.
Experienced investors understand that seasonality in the stock market is just noise compared to the opportunity for long-term gains. Fundamentals and the economic backdrop typically drive stock market performance, not calendar days. Instead of dwelling on the month’s temporary volatility, focus on the steady rhythm that comes by staying invested through different market cycles and sticking with a diversified portfolio that’s built for all seasons.


